Table of Contents
Okay, so Google’s up to something cool again—they’re working on this thing called Project Open Buildings. The whole idea? To create a kind of 3D-ish map of buildings all over the world. Why? Well, it’s supposed to make stuff like city planning, disaster response, and even things like AR (yeah, that fancy augmented reality) way more useful and accessible.

|
| Image showing a area with two image one showing real and another processed which tells about the number of building and its height. |
What’s 2.5D?
Alright, so 2.5D isn’t fully 3D, but it’s also not just plain old flat 2D. Think of it as giving a little “pop” to a flat image—like you can tell how tall a building is or what shape it has without going all the way into full 3D. It’s like 2D with a sprinkle of extra pizzazz.
Count and Analyze Buildings in Your Area
The main cool stuff is actually you can count the number of buildings in your colony, area, village or even in entire country. Not only you can count, even you can check the height of the buildings from 2017 to 2021 with heat map and bar graph. Just follow these steps:
-
Go to this website by clicking on the link at the bottom of the article
Image showing open building 2.5D homepage -
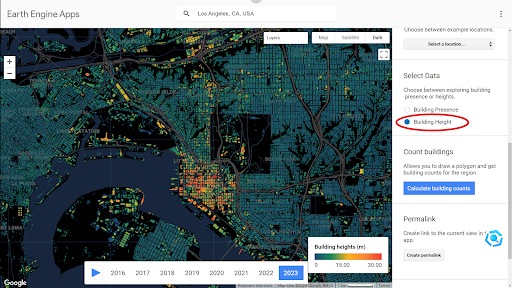
Right side of the page there is a option called select data. Select whatever you want to see. So let say first select:
-
Building Presence:
In this you will see map in red, green with some blue color. So, the red area has the maximum number of the buildings and blue one has the minimum number of buildings.
Red shaded area shows high density of building and blue less -
Building Height:
This has also the same color of heat map, pure red tells that the building is 24 meter tall and blue one is zero, as you can see in this graph.
In corner of the image you can see the bar graph of heights of buildings in an area according to colour
-
Building Presence:
In this you will see map in red, green with some blue color. So, the red area has the maximum number of the buildings and blue one has the minimum number of buildings.
-
After this the main part comes here. Go to Count building ssection.
this is count building section -
Click calculate building counts and go to map.
This is how you have to make shape from points to points. -
Select your area by marking points to points and form a closed shape.
This is how you can mark from one to another. but you have to make complete close shape -
After forming closed shape, it will automatically give numbers of buildings in a bar graph which is from 2017 to 2023.
BAR graph at the bottom left side is the number of buildings in the selected area. - After you done analyzing, clicking on Clear result. This will reset the map and you can do same for more area.
Cool Stuff About This Project
- Collecting All the Data: Google’s using satellite pics, aerial shots, and even stuff that users send in. They’re basically collecting everything about buildings from every angle.
- Easy to Access: The best part? They’re making this info open for anyone to use. So if you’re a coder, a researcher, or just someone curious about buildings, you can dive in and use it. No fancy permissions needed.
- Looks Cooler: Those 2.5D building models? They’ll make things like Google Maps look way more fun. Plus, they’ll actually give you useful details instead of just boring flat images.
- It’s Open Source!: If you’re into coding or urban stuff, this is a goldmine. It’s all open-source, so people can build cool things on top of it.
Where You Can Use This
- City Stuff: So, like, if you’re trying to plan a city or figure out where to build some new building or park or whatever, these models can make your job way easier. No need to guess where things fit anymore!
- Disaster Help: If there’s a big disaster, like a flood or earthquake, this data helps rescue teams figure out the spots that need help fast. It’s like a lifesaver, literally.
- AR Fun: Imagine you’re walking around, you point your phone at some random building, and—boom—it tells you cool stuff like how tall it is or when it was made. Devs could make some crazy apps with this data, for sure.
Why It’s Cool
Real talk—this is awesome for so many reasons. City planners can stop messing up 😁 and actually make smarter decisions. Rescuers can move faster when bad stuff happens. And even normal peeps (like us!) can just geek out about buildings and cities. It’s like having a cheat code for city life. Who wouldn’t want that?
So, What’s the Point?
Alright, here’s the deal. Google’s Project Open Buildings 2.5D isn’t just some boring techy thing. It’s for everyone—student, home planners, investors, business man, rescue teams, even people who just wanna explore their city in a cooler way. Honestly, it’s kinda awesome, and it’s probably gonna change how we think about cities.
Source:
https://mmeka-ee.projects.earthengine.app/
FAQs
What is Google's Project Open Buildings 2.5D?
Project Open Buildings 2.5D is an initiative by Google to map global buildings in a semi-3D format, aiding city planning, disaster response, and augmented reality applications.
What is 2.5D mapping?
2.5D mapping provides an enhanced visual representation of 2D images, allowing insights like building heights and shapes without full 3D modeling.
How can I count buildings in my area using Open Buildings 2.5D?
By selecting your area on the map, you can mark points to form a shape, and the tool will calculate the number of buildings and their heights. For more details you can read it here.


